Outliers and Anomalies
In machine learning, there is a concept called anomaly detection or outlier detection. These are often used interchangeably. Wikipedia explains this as:
… the identification of items, events or observations which do not conform to an expected pattern or other items in a dataset.
Simply, we are trying to find something abnormal. But what is abnormal? How do we define it? Could abnormality mean different things in different situations? Personally, I like to differentiate outliers from anomalies. They are both similar in the sense that we often want to find them, either to remove them from the data or to focus our attention to them specifically. I will explain why I think the difference matters, and how to detect them using different methodologies.
Some definitions
Let’s first define what I mean by outliers and anomalies:
- An outlier is an improbable data point, e.g., very high values that differ from normal.
- An anomaly is something created by a different process entirely. There is a different underlying function or a distribution. The data point itself might otherwise seem similar to normal data.
Ok, now that that’s out of the way, let’s move on to a toy example which will explain what I mean much better.
Example
Let’s say we have a Data Scientist who works as a contractor. The number of hours varies a bit, but the hourly rate is always 10 credits. Let’s look at the figure below.
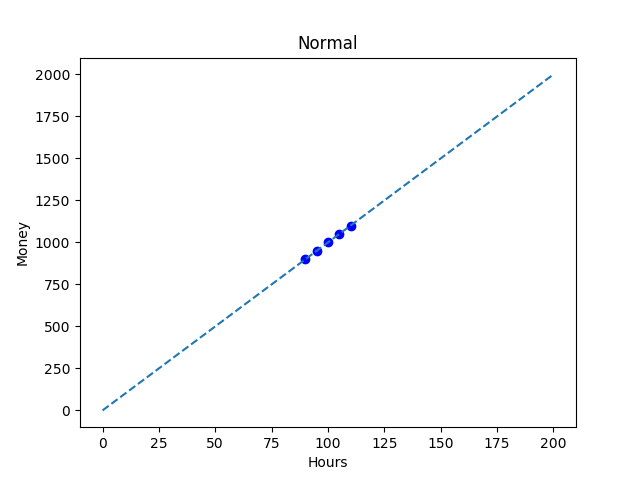
It’s pretty easy to see that the working hours and salaries follow a very simple linear distribution. If you work 100 hours, you get 1,000 credits.
Next, let’s consider some outliers. There are some new data points in the next figure.
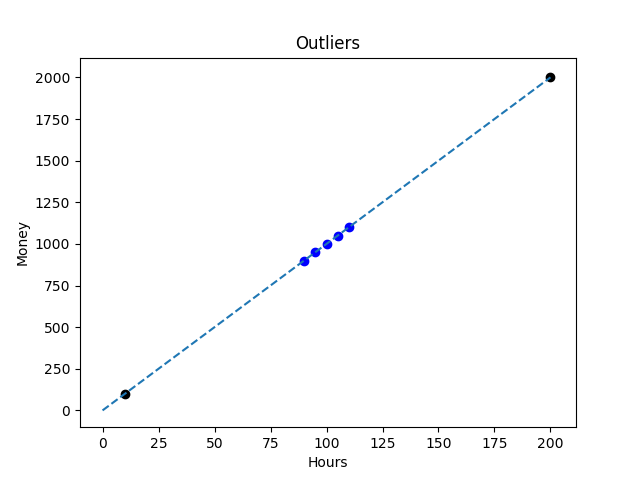
We can see that these new points are far away from the original data. Sometimes our Data Scientist works 200 hours, sometimes much less. But the important point is new observations still follow the same distribution as the original data. In this case, most distance-based and density-based outlier detection algorithms will flag these points as outliers, as they should.
Now we are getting to the interesting part. What is the Data Scientist works for 100 hours and gets paid 1,500 credits instead of 1,000?
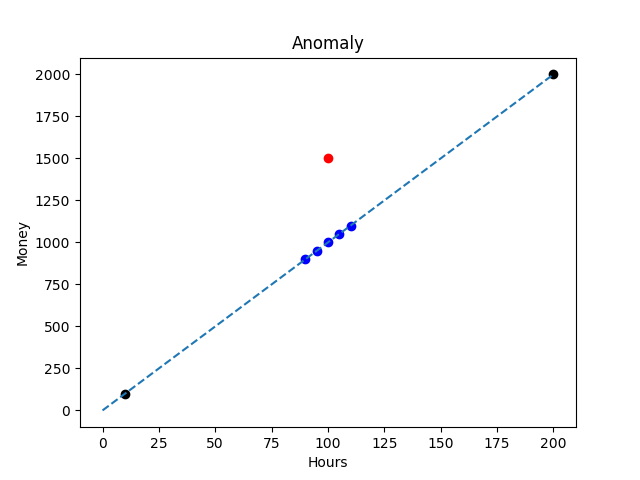
The latest observation (in red) is actually closer to the normal data than the other points. It’s even possible that it’s not classified as an outlier in this case. On the other hand, it does not follow the same distribution as the rest of the data. Now this is an anomaly. It was created by a different process than everything else in this data set. Maybe it turns out to be an error in accounting, or the hourly rate increased, but it’s an anomaly nonetheless.
The above situation demonstrates why I think it’s important to distinguish anomalies from outliers. Now, how would one go about detecting the anomaly? One interesting method is autoencoder, which would learn the underlying function that created the data (assuming the anomaly is not included in the training set). Then, it calculates the error for each data point. Then outliers would be considered normal as they are created by the same linear function, while the anomaly gets a higher error. If this error is above a certain threshold, an alert is created.
TL;DR
To sum things up, an outlier is a data point which is improbable. On the other hand, an anomaly is something that’s impossible given the expected distribution. It’s not always necessary to make this distinction, but I believe sometimes the difference matters.